

Wildland Fire Simulation using the DEVS-FIRE API
The goal of the DEVS-FIRE API is to allow developer and researchers to integrate the wildland fire simulation into their own applications. For example, when developing drones' path planning algorithms for monitoring wildfires, it is challenging to test the algorithms on real fire scenarios due to accessibility and safety concerns. The developed API makes it possible to integrate wildfire spread simulation into the research project for evaluating different path planning algorithms. The DEVS-FIRE API allows users from all over the world to use the DEVS-FIRE model to run simulations by programming to an API. The simulations are run on the DEVS-FIRE simulation server in the cloud, and the simulation results are returned to users through the API.
DEVS-FIRE is a discrete event wildland fire simulation model. It has several sub-models to support different types of wildland fire simulations, including fire spread simulation, fire suppression simulation, and prescribed fire simulation with dynamic ignitions. The fire spread model is the core of DEVS-FIRE, which uses a cellular space to model a wildland area and employs Rothermel’s fire behavior model to compute the rate of spread. Built on top of the fire spread model, the fire suppression model supports fire suppression simulation with different tactic, e.g., direct attack, parallel attack, and indirect attack. The prescribed fire simulation model supports prescribed fire simulation using different ignition techniques such as backfire, head fire, spot head fire, and ring fire.
DEVS-FIRE API Documentation
A set of API methods have been developed, covering different ways of setting up and running the simulations and getting simulation results. Documentation of the DEVS-FIRE API can be found below.
--------> DEVS-FIRE API Documentation <--------
Examples
Several examples with source code (in both Java and Python) are provided below to show how to set up and run fire spread simulations using the API. The API_FireState_Visualization.java allows visualizing the simulation results returned from the API when programming in Java. When programming in Python, you may visualize the results in your own way.
- MultiStep_ContinueSimulation_defaultGIS.java (The corresponding Python code)
- MultiStep_userDefinedGIS_dynamicWind.java (The corresponding Python code)
- connectAndRun_userDefinedGIS.java (The corresponding Python code)
- API_FireState_Visualization.java
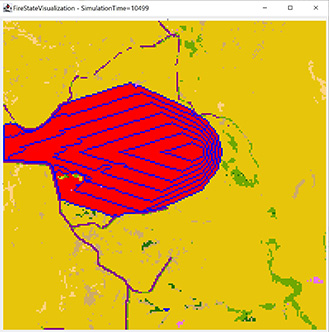
This example shows how to set up a simulation and continue running the simulation in a stepwise fashion. The procedure of using the API is described below: 1) connect to the DEVS-FIRE API server and obtain a key, which is needed for all following-on calls. 2) set wind condition for the simulation. 3) set the location of the cell space using the latitude and longitude info, which decides what fuel and terrain data from the LANDFIRE database will be used. 4) get the fuel data of the cell space and display it using the API_FireState_Visualization. You may skip this step if there is no need to display the fuel. 5)set the ignition point. If you need to set multiple ignition point, you may invoke the setPointIgnition multiple times. 6) invoke continueSimulation to run simulation in an iterative fashion. Each iteration continues on top of the last iteration. In each iteration, the simulation results of all burning cells' ID and ignition time are returned as a String. To visualize the simulation result, this program uses the API_FireState_Visualization class. It also invokes the getPerimeterCells API to obtain the list of perimeter cells at the end of each iteration and display it using the API_FireState_Visualization. Below is a screenshot of the simulation result visualization.
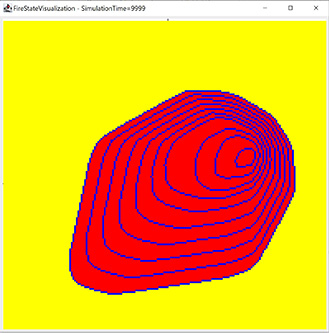
This example shows how to set up and run a simulation using user-defined GIS fuel/slope/aspect data and dynamic wind conditions. The procedure of using the API is described below: 1) connect to the DEVS-FIRE API server and obtain a key, which is needed for all following-on calls. 2) set wind condition by reading from a wind text file (weather_artificial.txt). 3) load user-defined fuel, slope, and aspect data from txt files (fuel.txt, slope.txt, aspect.txt). 4) set ignition point. 5) run simulation in a stepwise fashion and obtain simulation results (ignited cells and fire perimeter cells). The simulation results are visualized by the API_FireState_Visualization class.
This example shows how to set up and run a simulation using user-defined GIS fuel/slope/aspect data. The procedure of using the API is described below: 1) connect to the DEVS-FIRE API server and obtain a key, which is needed for all following-on calls. 2) set wind condition for the simulation. 3) set the cell resolution and cell space size. 4) load user-defined fuel, slope, and aspect data from txt files (fuel.txt, slope.txt, aspect.txt). 5) set ignition point. 6) run simulation by giving a simulation time. the simulation results of all burning cells' ID and ignition time are returned as a String. To visualize the simulation result, you may use the API_FireState_Visualization class.
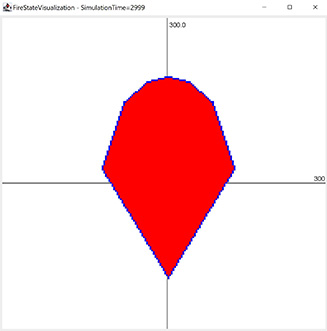
This class visualizes the simulation result (a Java string) returned from the DEVS-FIRE API call. This class is not needed if you do not want to visualize the results or perfer to visualize the results in other ways.